
Watch now: A book, a garden and the ELL students at Lincoln Northeast who found a space to belong | Education
Tagwa Mohmed remembers harvesting ripe, red tomatoes as a child growing up in her native country of Sudan. Gardening there was just part of life, and her family planted everything under the sun.
“Any kind of vegetable,” she said, “we would plant.”

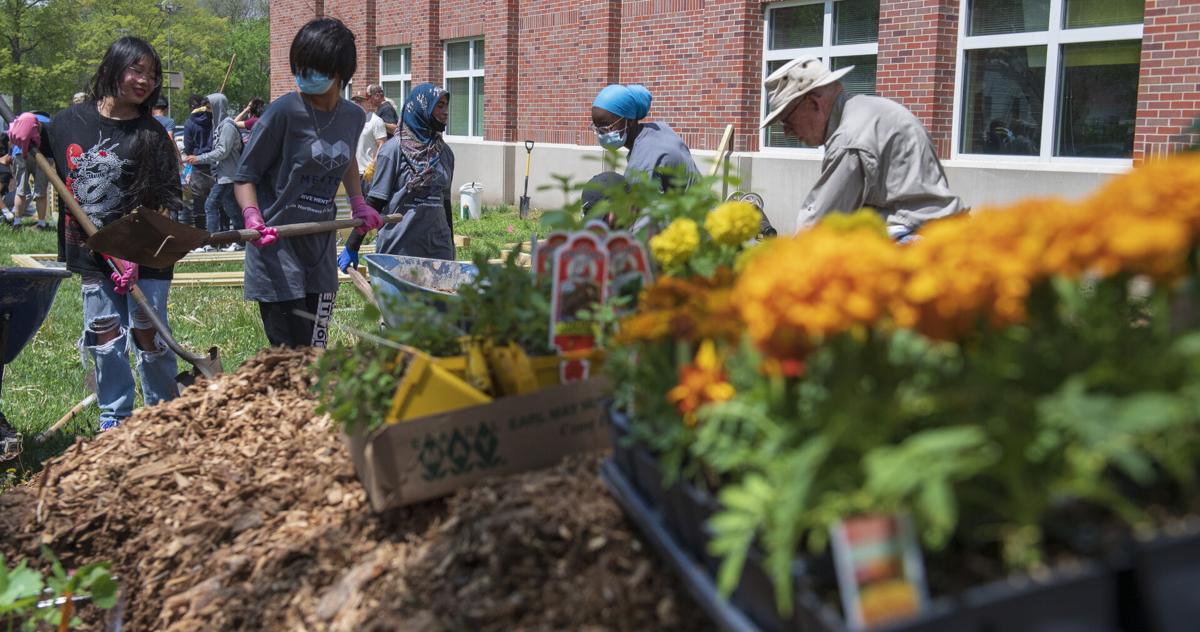
Charlie Wortmann helps Tagwa Mohmed (center) and Pyoe Aye lift a wheelbarrow to fill a garden bed with dirt outside Lincoln Northeast High School.
So Mohmed — with her green thumb and blue gardening gloves — naturally fit in with the other English language learners moving soil, shoveling mulch and planting marigolds and oregano in the garden boxes at Lincoln Northeast High School on Wednesday.
A garden by the students, for the students.
The idea came to Brooke David and her ELL students at Northeast last year after they had finished reading Paul Fleischmann’s book “Seedfolks.” The novella tells the story of a Vietnamese girl and a group of immigrants who turn a vacant city lot into a community garden. But not just any garden — a garden that represented each character, with crops from their home country.
The students at Northeast wanted to bring a similar project to their school.
“Each country knows about gardening,” said Mohmed, who moved to the U.S. in 2018.
So they got permission from Principal Keri Applebee and added partners along the way: Civic Nebraska, which runs the school’s Community Learning Center, the Kiwanis Club and Northeast’s Food, Energy, Water and Societal Systems focus program.
Lincoln Board of Education considering changes to public comment policy
LPS, UNL partnering on business focus program at Standing Bear High School
The students then spent the year researching what it takes to care for a garden, in addition to learning about food scarcity and the impacts of food deserts.
They picked what vegetables and herbs they intended to plant: sweet peppers, hot peppers, thyme, cilantro, chives, broccoli, cauliflower, cherry tomatoes, basil, sage, cucumbers. Flowers in their own separate bed to act as pollinators and to repel insects.
“Some of the vegetables come from recipes they’ve made with their families, and so it’s just an opportunity for them to share those traditions with us,” David said.
And they figured out where to plant everything, too: on the south side of the school, where the garden will get plenty of sun.
Then on a hot May afternoon that contained hints of summer came the fun part.

LNE students gather various plants and markers on an organizational chart while planning a community garden outside the school.
With drills and hammers and the help of staff, Kiwanis members and Civic Nebraska, students erected four garden boxes with wooden frames and corrugated-steel walls. With shovels, they scooped mountains of dirt and mulch into wheelbarrows. And with careful precision and planning, they planted the herbs, seeds and flowers (consulting the homemade map at all times).
“They researched how many (seeds) we can put in each square foot of our garden, like spinach, for example, they know that they can put nine seeds in that space, so they made a map and everything to figure out how many they needed to purchase,” said Bailey Feit, coordinator of the FEWSS focus program.
The garden is empowering to the students, Feit said, and a way for them to connect to the school and a community they might be totally new to.
“They’re going to want to come here so they can see all of the hard work they’ve put in,” she said.
There are plans to expand the garden in the future with a greenhouse and additional garden boxes.
And come harvest time, there are plans to share the spoils with the community.
“We’re hoping we can have family community nights to harvest the vegetables,” David said. “This will just be a place for the community to gather and learn from each and get to know each other.”
Watch now: North Star students treated to rockin’ drum lesson from special guest
A mother’s love: LPS teacher’s journey toward adoption began by saying yes to foster care
Breaking down Lincoln’s public schools: Enrollment, test scores and more
Adams

Adams Elementary: 7401 Jacobs Creek Drive
Enrollment: 776 students
77.9% white, 2.3% Black or African American, 9.6% Asian, 4.9% Hispanic/Latino, 5.4% two or more races
Free and reduced-price lunch participation: 8.6% free, 2.3% reduced
Gifted students: 10.4%
Statewide test scores (percent who meet or exceed standards): 73 language arts; 76 math
Arnold
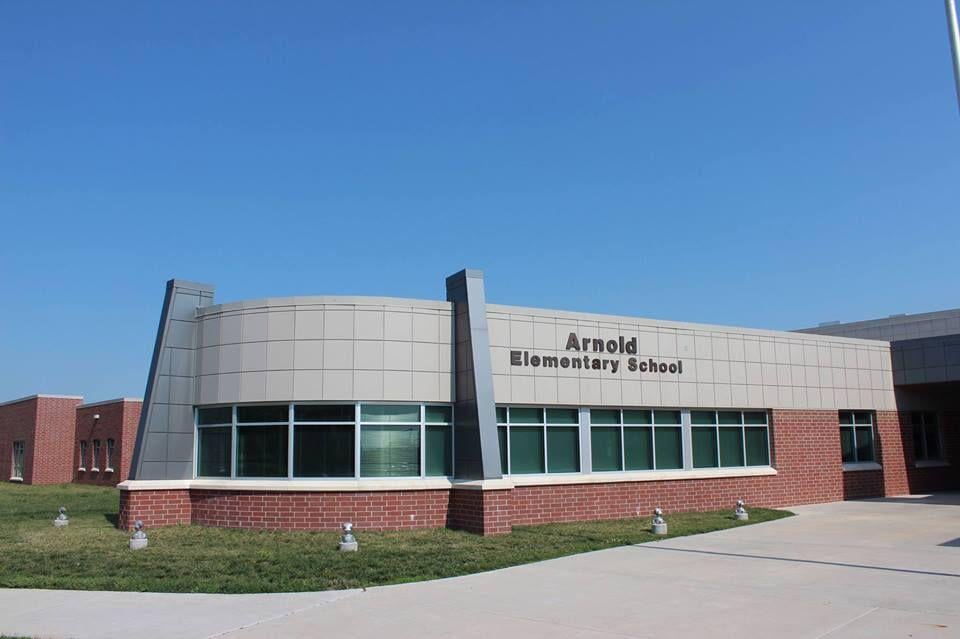
Arnold Elementary: 5000 Mike Scholl St.
Enrollment: 742 students
57.1% white, 1.5% American Indian or Alaska Native, 8.4% Black or African American, 1.5% Asian, 19.2% Hispanic/Latino, 0.3% Native Hawaiian or Pacific Islander, 12% two or more races
Free and reduced-price lunch participation: 46.7% free, 12.7% reduced
Gifted: 2.8%
Statewide test scores (percent who meet or exceed standards): 44 language arts, 32 math
Beattie

Beattie Elementary: 1901 Calvert St.
Enrollment: 368 students
73.6% white, 0.5% American Indian or Alaska Native, 3.3% Black or African American, 1.1% Asian, 8.2% Hispanic/Latino, 13.3% two or more races
Free or reduced-price lunch participation: 25.3% free, 8.2% reduced price
Gifted: 6.0%
Statewide test scores (percent who meet or exceed standards): 59 language arts, 55 math
Belmont

Belmont Elementary: 3425 N. 14th St.
Enrollment: 829 students
42.4% white, 0.9% American Indian or Alaska Native, 15.7% Black or African American, 2.2% Asian, 26.9% Hispanic/Latino, 11.8% two or more races
Free and reduced-price lunch participation: 67.5% free, 11.0% reduced
Gifted: 3.7%
Statewide test scores (percent who meet or exceed standards): 44 language arts, 34 math
Brownell
Brownell Elementary: 6000 Aylesworth Ave.
Enrollment: 320 students
65.9% white, 4.9% Black or African American, 0.3% Asian, 14.8% Hispanic/Latino, 14.1% two or more races
Free and reduced-price lunch participation: 45.2% free, 10.5% reduced
Gifted: 2.3%
Statewide test scores (percent who meet or exceed standards): 50 language arts, 37 math
Calvert
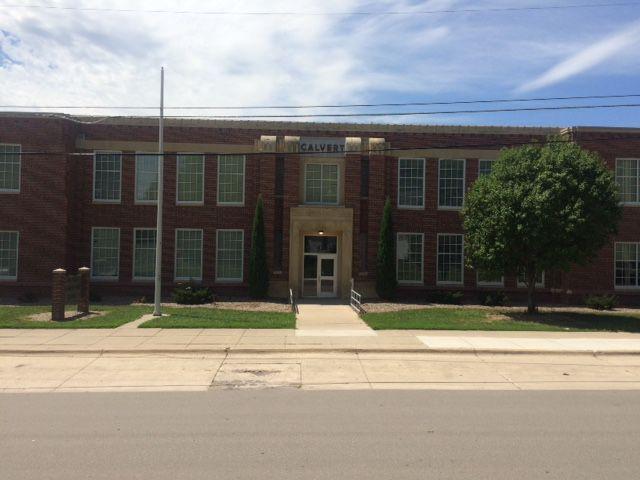
Calvert Elementary: 3709 S. 46th St.
Enrollment: 361 students
62.9% white, 1.2% American Indian or Alaska Native, 7.1% Black or African American, 1.5% Asian, 12.0% Hispanic/Latino, 15.3% two or more races
Free and reduced-price lunch participation: 45.7% free, 6.7% reduced
Gifted: 11.3%
Statewide test scores (percent who meet or exceed standards): 47 language arts, 31 math
Campbell

Campbell Elementary: 2200 Dodge St.
Enrollment: 591 students
46.6% white, 0.4% American Indian or Alaska Native, 14.3% Black or African American, 11.3% Asian, 16.6% Hispanic/Latino, 10.9% two or more races
Free and reduced-price lunch participation: 59.4% free, 10.5% reduced
Gifted: 4.2%
Statewide test scores (percent who meet or exceed standards): 38 language arts, 34 math
Cavett
Cavett Elementary: 7701 S. 36th St.
Enrollment: 580 students
77.0% white, 0.5% American Indian or Alaska Native, 2.9% Black or African American, 4.0% Asian, 8.9% Hispanic, 6.6% two or more races
Free and reduced-price lunch participation: 10.4% free, 3.6% reduced
Gifted: 13.3%
Statewide test scores (percent who meet or exceed standards): 70 language arts, 69 math
Clinton
Clinton Elementary: 1520 N. 29th St.
Enrollment: 392 students
39.2% white, 0.3% American Indian or Alaska Native, 24.3% Black or African American, 4.7% Asian, 21.0% Hispanic/Latino, 10.5% two or more races
Free and reduced-price lunch participation: 81.2% free, 10.5% reduced
Gifted: 3.6%
Statewide test scores (percent who meet or exceed standards): 30 language arts, 30 math
Eastridge

Eastridge Elementary: 6245 L St.
Enrollment: 291 students
72.9% white, 1.0% American Indian or Alaska Native, 4.5% Black or African American, 1.4% Asian, 10.3% Hispanic/Latino, 10.0% two or more races
Free and reduced-price lunch participation: 25.8% free, 10.0% reduced
Gifted: 7.9%
Statewide test scores (percent who meet or exceed standards): 55 language arts, 51 math
Elliott
Elliott Elementary: 225 S. 25th St.
Enrollment: 383 students
23.3% white, 1.8% American Indian or Alaska Native, 13.7% Black or African American, 12.8% Asian, 33.7% Hispanic/Latino, 0.3% Native Hawaiian or Pacific Islander, 14.3% two or more races
Free and reduced-price lunch participation: 76.4% free, 6.3% reduced
Gifted: 4.5%
Statewide test scores (percentage who meet or exceed standards): 42 language arts, 35 math
Everett
Everett Elementary: 1123 C St.
Enrollment: 374 students
27.8% white, 0.9% American Indian or Alaska Native, 13.5% Black or African American, 9.9% Asian, 40.4% Hispanic/Latino, 7.5% two or more races
Free and reduced-price lunch participation: 73.7% free, 8.7% reduced
Gifted: 5.4%
Statewide test scores (percentage who meet or exceed standards): 37 language arts, 24 math
Fredstrom

Fredstrom Elementary, 5700 N.W. 10th St.
Enrollment: 437 students
74.0% white, 0.5% American Indian or Alaska Native, 1.7% Black or African American, 3.6% Asian, 9.7% Hispanic, 10.4% two or more races
Free and reduced-price lunch participation: 22.3% free, 6.3% reduced
Gifted: 7.5%
Statewide test scores (percentage who meet or exceed standards): 52 language arts, 54 math
Hartley

Hartley Elementary, 730 N. 33rd St.
Enrollment: 339 students
37.5% white, 2.3% American Indian or Alaska Native, 17.5% Black or African American, 3.6% Asian, 25.9% Hispanic/Latino, 1.0% Native Hawaiian or Pacific Islander, 12.3% two or more races
Free and reduced-price lunch participation: 71.5% free, 9.4% reduced
Gifted: 3.2%
Statewide test scores (percentage who meet or exceed standards): 38 language arts, 28 math
Hill

Hill Elementary, 5230 Tipperary Trail
Enrollment: 449 students
72.2% white, 0.5% American Indian or Alaska Native, 4.8% Black or African American, 5.3% Asian, 10.3% Hispanic/Latino, 7.0% two or more races
Free and reduced-price lunch participation: 24.0% free, 5.0% reduced
Gifted: 10.3%
Statewide test scores (percentage who meet or exceed standards): 70 language arts, 59 math
Holmes

Holmes Elementary, 5230 Sumner St.
Enrollment: 393 students
70.7% white, 3.5% Black or African American, 3.5% Asian, 10.1% Hispanic/Latino, 0.3% Native Hawaiian or Pacific Islander, 11.9% two or more races
Free and reduced-price lunch participation: 37.1% free, 7.0% reduced
Gifted: 11.3%
Statewide test scores (percentage who meet or exceed standards): 61 language arts, 47 math
Humann
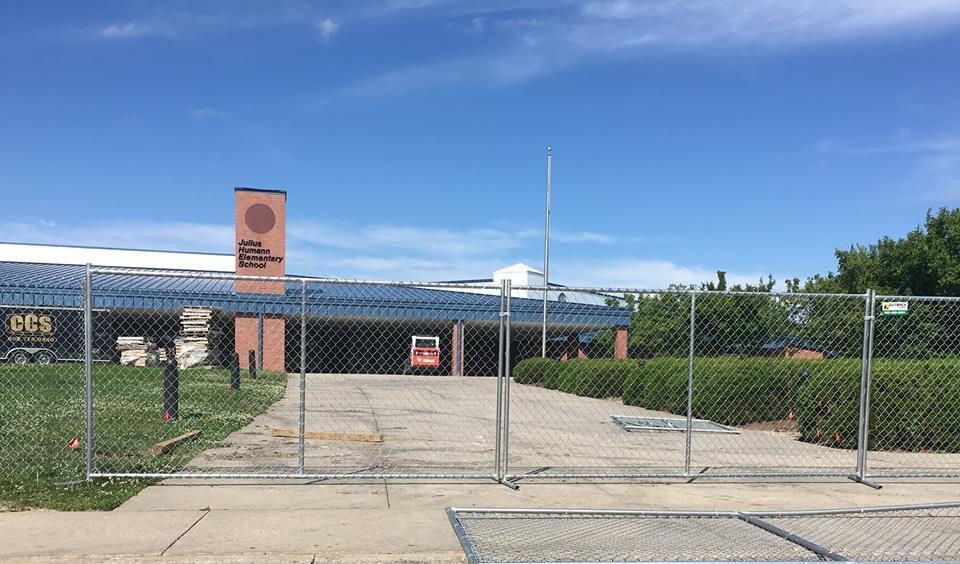
Humann Elementary, 6720 Rockwood Lane
Enrollment: 564 students
78.8% white, 0.6% American Indian or Alaska Native, 4.2% Black or African American, 1.3% Asian, 5.9% Hispanic/Latino, 9.3% two or more races
Free and reduced-price lunch participation: 23.9% free, 4.0% reduced
Gifted: 16.3%
Statewide test scores (percentage who meet or exceed standards): 72 language arts, 67 math
Huntington
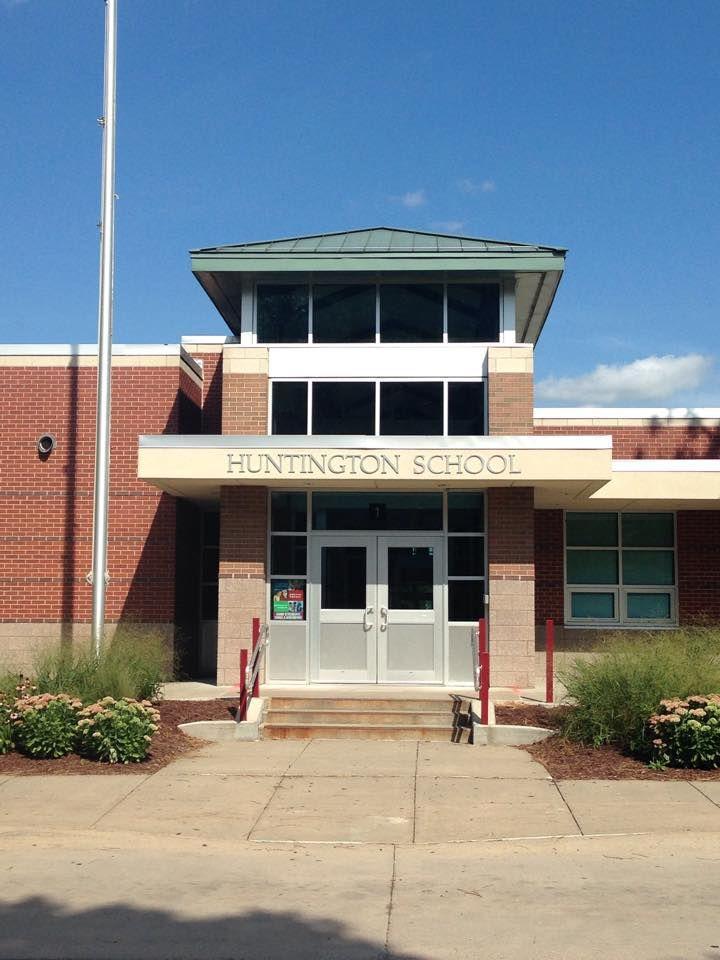
Huntington Elementary, 2900 N. 46th St.
Enrollment: 370 students
45.0% white, 0.6% American Indian or Alaska Native, 12.0% Black or African American, 1.5% Asian, 24.6% Hispanic/Latino, 16.2% two or more races
Free and reduced-price lunch participation: 67.0% free, 14.1% reduced
Gifted: 4.8%
Statewide test scores (percentage who meet or exceed standards): 32 language arts, 23 math
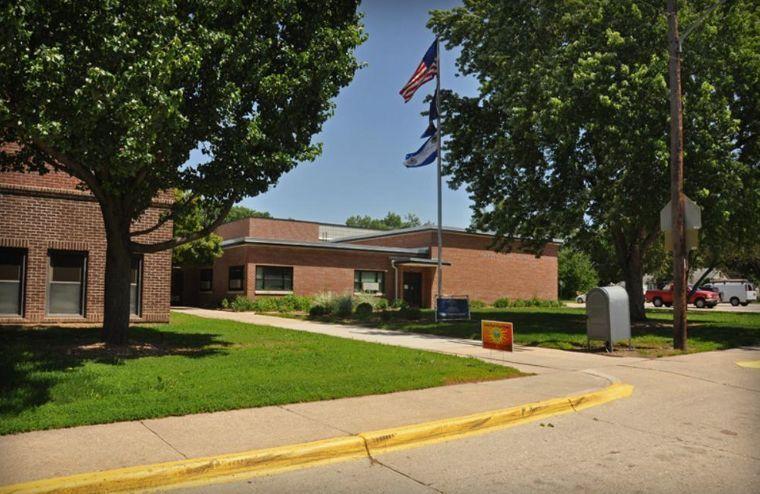
Kahoa

Kahoa Elementary, 7700 Leighton Ave.
Enrollment: 537 students
78.8% white, 0.4% American Indian or Alaska Native, 3.9% Black or African American, 2.6% Asian, 6.7% Hispanic/Latino, 7.6% two or more races
Free and reduced-price lunch participation: 22.9% free, 7.3% reduced
Gifted: 6.9%
Statewide test scores (percentage who meet or exceed standards): 66 language arts, 64 math
Kloefkorn
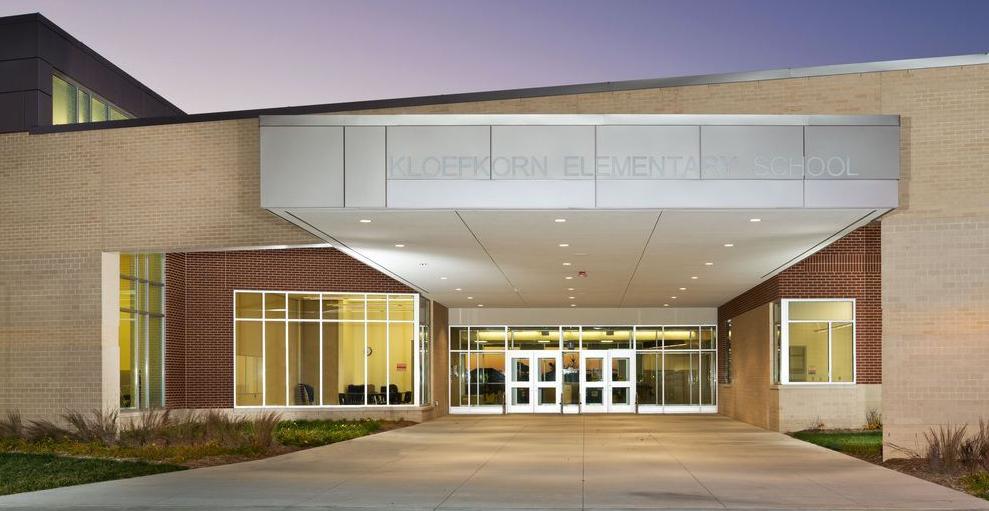
Kloefkorn Elementary, 6601 Glass Ridge Drive
Enrollment: 488 students
83.7% white, 0.7% American Indian or Alaska Native, 1.5% Black or African American, 4.4% Asian, 5.3% Hispanic/Latino, 4.4% two or more races
Free and reduced-price lunch participation: 6.2% free, 2.0% reduced
Gifted: 11.9%
Statewide test scores (percentage who meet or exceed standards): 77 language arts, 72 math
Kooser

Kooser Elementary, 7301 N. 13th St.
Enrollment: 821 students
63.5% white, 0.1% American Indian or Alaska Native, 5.6% Black or African American, 11.9% Asian, 11.1% Hispanic/Latino, 0.1% Native Hawaiian or Pacific Islander, 7.6% two or more races
Free and reduced-price lunch participation: 30.0% free, 8.3% reduced
Gifted: 2.9%
Statewide test scores (percentage who meet or exceed standards): 55 language arts, 49 math
Lakeview

Lakeview Elementary, 300 Capitol Beach Blvd.
Enrollment: 400 students
53.0% white, 0.8% American Indian or Alaska Native, 9.3% Black or African American, 3.8% Asian, 22.8% Hispanic/Latino, 10.5% two or more races
Free and reduced-price lunch participation: 57.0% free, 9.5% reduced
Gifted: 1.8%
Statewide test scores (percentage who meet or exceed standards): 35 language arts, 29 math
Maxey

Maxey Elementary, 5200 S. 75th St.
Enrollment: 683 students
75.9% white, 0.3% American Indian or Alaska Native, 1.2% Black or African American, 13.5% Asian, 3.4% Hispanic/Latino, 0.2% Native Hawaiian or Pacific Islander, 5.5% two or more races
Free and reduced-price lunch participation: 10.6% free, 3.4% reduced
Gifted: 10.4%
Statewide test scores (percentage who meet or exceed standards): 70 language arts, 69 math
McPhee

McPhee Elementary, 820 Goodhue Blvd.
Enrollment: 304 students
26.8% white, 1.4% American Indian or Alaska Native, 16.3% Black or African American, 12.7% Asian, 35.9% Hispanic/Latino and 6.9% two or more races
Free and reduced-price lunch participation: 77.2% free, 6.9% reduced
Gifted: 4.0%
Statewide test scores (percentage who meet or exceed standards): 36 language arts, 22 math
Meadow Lane

Meadow Lane Elementary, 7200 Vine St.
Enrollment: 620 students
72.1% white, 0.2% American Indian or Alaska Native, 2.8% Black or African American, 2.6% Asian, 13.8% Hispanic/Latino, 8.6% two or more races
Free and reduced-price lunch participation: 33.6% free, 8.1% reduced
Gifted: 8.3%
Statewide test scores (percentage who meet or exceed standards): 51 language arts, 39 math
Morley

Morley Elementary, 6800 Monterey Drive
Enrollment: 421 students
78.1% white, 0.2% American Indian or Alaska Native, 3.8% Black or African American, 0.2% Asian, 7.4% Hispanic, 0.5% Native Hawaiian or Pacific Islander, 9.7% two or more races
Free and reduced-price lunch participation: 20.2% free, 5.5% reduced
Gifted: 15.4%
Statewide test scores (percentage who meet or exceed standards): 69 language arts, 56 math
Norwood Park
Norwood Park Elementary, 4710 N. 72nd St.
Enrollment: 238 students
68.0% white, 4.4% Black or African American, 2.4% Asian, 18.9% Hispanic/Latino, 6.3% two or more races
Free and reduced-price lunch participation: 46.6% free, 15.0% reduced
Gifted: 4.9%
Statewide test scores (percentage who meet or exceed standards): 43 language arts, 30 math
Pershing

Pershing Elementary, 6402 Judson St.
Enrollment: 430 students
57.5% white, 0.5% American Indian or Alaska Native, 6.6% Black or African American, 3.3% Asian, 20.6% Hispanic/Latino, 11.5% two or more races
Free and reduced-price lunch participation: 54.5% free, 12.7% reduced
Gifted: 4.3%
Statewide test scores (percentage who meet or exceed standards): 49 language arts, 50 math
Prescott

Prescott Elementary, 1930 S. 20th St.
Enrollment: 492 students
44.9% white, 0.9% American Indian or Alaska Native, 13.8% Black or African American, 7.3% Asian, 18.8% Hispanic/Latino, 0.5% Native Hawaiian or Pacific Islander, 13.8% two or more races
Free and reduced-price lunch participation: 51.2% free, 9.5% reduced
Gifted: 7.5%
Statewide test scores (percentage who meet or exceed standards): 52 language arts, 36 math
Pyrtle
Pyrtle Elementary, 721 Cottonwood Drive
Enrollment: 454 students
78.9% white, 1.9% Black or African American, 2.6% Asian, 10.0% Hispanic/Latino, 6.7% two or more races
Free and reduced-price lunch participation: 17.3% free, 3.6% reduced
Gifted: 17.3%
Statewide test scores (percentage who meet or exceed standards): 68 language arts, 60 math
Randolph

Randolph Elementary, 1024 S. 37th St.
Enrollment: 428 students
61.4% white, 0.9% American Indian or Alaska Native, 5.6% Black or African American, 3.7% Asian, 16.4% Hispanic/Latino, 0.5% Native Hawaiian or Pacific Islander, 11.4% two or more races
Free and reduced-lunch participation: 45.6% free, 8.9% reduced
Gifted: 3.0%
Statewide test scores (percentage who meet or exceed standards): 53 language arts, 40 math
Riley

Riley Elementary, 5021 Orchard St.
Enrollment: 321 students
49.5% white, 0.6% American Indian or Alaska Native, 6.9% Black or African American, 3.4% Asian, 22.7% Hispanic/Latino, 16.8% two or more races
Free and reduced-price lunch participation: 55.1% free, 10.0% reduced
Gifted: 5.3%
Statewide test scores (percentage who meet or exceed standards): 44 language arts, 42 math
Roper

Roper Elementary, 2323 S. Coddington
Enrollment: 803 students
53.5% white, 0.4% American Indian or Alaska Native, 9.9% Black or African American, 6.9% Asian, 21.2% Hispanic/Latino, 8.1% two or more races
Free and reduced-price lunch participation: 40.0% free, 10.4% reduced
Gifted: 6.5%
Statewide test scores (percentage who meet or exceed standards): 44 language arts, 46 math
Rousseau

Rousseau Elementary, 3701 S 33rd St.
Enrollment: 531 students
72.9% white, 0.2% American Indian or Alaska Native, 4.0% Black or African American, 3.4% Asian, 7.0% Hispanic/Latino, 0.2% Native Hawaiian or Pacific Islander, 12.2% two or more races
Free and reduced-price lunch participation: 22.7% free, 8.4% reduced
Gifted: 14.7%
Statewide test scores (percentage who meet or exceed standards): 68 language arts, 63 math
Saratoga
Saratoga Elementary, 2215 S. 13th St.
Enrollment: 235 students
48.5% white, 1.5% American Indian or Alaska Native, 7.8% Black or African American, 3.4% Asian, 26.2% Hispanic/Latino, 12.6% two or more races
Free and reduced-price lunch participation: 61.7% free, 9.7% reduced
Gifted: 5.8%
Statewide test scores (percentage who meet or exceed standards): 36 language arts, 25 math
Sheridan

Sheridan Elementary, 3100 Plymouth Ave.
Enrollment: 407 students
86.0% white, 0.2% American Indian or Alaska Native, 1.5% Black or African American, 0.5% Asian, 4.9% Hispanic/Latino, 6.9% two or more races
Free and reduced-price lunch participation: 12.0% free, 5.2% reduced
Gifted: 17.4%
Statewide test scores (percentage who meet or exceed standards): 74 language arts, 64 math
West Lincoln

West Lincoln Elementary, 630 W. Dawes Ave.
Enrollment: 505 students
37.0% white, 0.4% American Indian or Alaska Native, 9.7% Black or African American, 2.4% Asian, 41.2% Hispanic, 9.3% two or more races
Free and reduced-price lunch participation: 72.1% free, 10.3% reduced
Gifted: 3.8%
Statewide test scores (percentage who meet or exceed standards): 32 language arts, 29 math
Wysong
Wysong Elementary, 7901 Blanchard Blvd.
Enrollment: 684 students
89.9% white, 0.1% Black or African American, 2.2% Asian, 3.8% Hispanic/Latino, 3.9% two or more races
Free and reduced-price lunch participation: 3.9% free, 1.5% reduced
Gifted: 7.5%
Statewide test scores (percentage who meet or exceed standards): 75 language arts, 68 math
Zeman

Zeman Elementary, 4900 S. 52nd St.
Enrollment: 440 students
63.0% white, 0.9% American Indian or Alaska Native, 4.8% Black or African American, 3.0% Asian, 16.1% Hispanic/Latino, 12.3% two or more races
Free and reduced-price lunch participation: 29.5% free, 9.3% reduced
Gifted: 3.4%
Statewide test scores (percentage who meet or exceed standards): 58 language arts, 49 math
Culler

Culler Middle School, 5201 Vine St.
Enrollment: 708 students
39.4% white, 1.0% American Indian or Alaska Native, 14.7% Black or African American, 7.1% Asian, 27.3% Hispanic/Latino, 0.1% Native Hawaiian or Pacific Islander, 10.5% two or more races
Free and reduced-price lunch participation: 60.9% free, 9.3% reduced
Gifted: 8.3%
Statewide test scores (percentage who meet or exceed standards): 32 language arts, 30 math
Dawes
Dawes Middle School, 5130 Colfax Ave.
Enrollment: 398 students
55.0% white, 0.3% American Indian or Alaska Native, 8.3% Black or African American, 2.3% Asian, 19.8% Hispanic/Latino, 14.3% two or more races
Free and reduced-price lunch participation: 53.3% free, 13.1% reduced
Gifted: 10.6%
Statewide test scores (percentage who meet or exceed standards): 37 language arts, 32 math
Goodrich

Goodrich Middle School, 4600 Lewis Ave.
Enrollment: 818 students
42.9% white, 1.1% American Indian or Alaska Native, 13.0% Black or African American, 4.0% Asian, 29.5% Hispanic/Latino, 9.5% two or more races
Free and reduced-price lunch participation: 61.6% free, 11.1% reduced
Gifted: 9.7%
Statewide test scores (percentage who meet or exceed standards): 36 language arts, 38 math
Irving

Irving Middle School, 2745 S. 22nd St.
Enrollment: 910 students
62.7% white, 0.8% American Indian or Alaska Native, 6.5% Black or African American, 3.2% Asian, 14.3% Hispanic/Latino, 12.5% two or more races
Free and reduced-price lunch participation: 35.4% free, 8.1% reduced
Gifted: 26.6%
Statewide test scores (percentage who meet or exceed standards): 55 language arts, 49 math
Lefler
Lefler Middle School, 1100 S. 48th St.
Enrollment: 558 students
57.9% white, 0.7% American Indian or Alaska Native, 9.5% Black or African American, 4.7% Asian, 15.8% Hispanic/Latino, 0.2% Native Hawaiian or Pacific Islander, 11.3% two or more races
Free and reduced-price lunch participation: 43.7% free, 12.0% reduced
Gifted: 13.8%
Statewide test scores (percentage who meet or exceed standards): 45 language arts, 45 math
Lux
Lux Middle School, 7800 High St.
Enrollment: 789 students
80.0% white, 0.1% American Indian or Alaska Native, 2.7% Black or African American, 3.8% Asian, 7.2% Hispanic/Latino, 0.1% Native Hawaiian or Pacific Islander, 6.1% two or more races
Free and reduced-price lunch participation: 10.5% free, 6.3% reduced
Gifted: 28.3%
Statewide test scores (percentage who meet or exceed standards): 66 language arts, 68 math
Mickle
Mickle Middle School, 2500 N. 67th St.
Enrollment: 719 students
70.9% white, 0.1% American Indian or Alaska Native, 2.8% Black or African American, 1.5% Asian, 11.8% Hispanic/Latino, 12.8% two or more races
Free and reduced-price lunch participation: 34.9% free, 9.5% reduced
Gifted: 17.1%
Statewide test scores (percentage who meet or exceed standards): 55 language arts, 53 math
Moore

Moore Middle School, 8700 Yankee Woods Drive
Enrollment: 646 students
86.4% white, 0.6% American Indian or Alaska Native, 0.6% Black or African American, 4.3% Asian, 3.4% Hispanic/Latino, 4.6% two or more races
Free and reduced-price lunch participation: 7.0% free, 2.3% reduced
Gifted: 27.6%
Statewide test scores (percentage who meet or exceed standards): 69 language arts, 78 math
Park
Park Middle School, 855 S. Eighth St.
Enrollment: 833 students
41.2% white, 0.6% American Indian or Alaska Native, 11.9% Black or African American, 6.7% Asian, 30.1% Hispanic/Latino, 0.2% Native Hawaiian or Pacific Islander, 9.2% two or more races
Free and reduced-price lunch participation: 55.8% free, 10.4% reduced
Gifted: 9.8%
Statewide test scores (percentage who meet or exceed standards): 37 language arts, 37 math
Pound

Pound Middle School, 4740 S. 45th St.
Enrollment: 700 students
67.6% white, 0.6% American Indian or Alaska Native, 4.6% Black or African American, 2.4% Asian, 12.4% Hispanic/Latino, 0.1% Native Hawaiian or Pacific Islander, 12.3% two or more races
Free and reduced-price lunch participation: 25.7% free, 8.6% reduced
Gifted: 22.4%
Statewide test scores (percentage who meet or exceed standards): 59 language arts, 60 math
Schoo

Schoo Middle School, 700 Penrose Drive
Enrollment: 898 students
63.9% white, 0.4% American Indian or Alaska Native, 7.2% Black or African American, 5.0% Asian, 12.1% Hispanic/Latino, 0.1% Native Hawaiian or Pacific Islander, 11.1% two or more races
Free and reduced-price lunch participation: 30.3% free, 9.7% reduced
Gifted: 15.5%
Statewide test scores (percentage who meet or exceed standards): 50 language arts, 48 math
Scott

Scott Middle School, 2200 Pine Lake Road
Enrollment: 1,182 students
77.7% white, 0.2% American Indian or Alaska Native, 3.2% Black or African American, 4.6% Asian, 7.2% Hispanic/Latino, 7.1% two or more races
Free and reduced-price lunch participation: 13.1% free, 4.3% reduced
Gifted: 30.1%
Statewide test scores (percentage who meet or exceed standards): 65 language arts, 70 math
East
East High School, 1000 S. 70th St.
Enrollment: 2,250 students
78.7% white, 0.2% American Indian or Alaska Native, 2.2% Black or African American, 4.6% Asian, 8.4% Hispanic/Latino, 5.8% two or more races
Free and reduced-price lunch participation: 14.6% free, 5.3% reduced
Gifted: 24.4%
Statewide test scores (percentage who meet or exceed standards): 59 language arts, 58 math, 63 science
Lincoln High

Lincoln High School, 2229 J St.
Enrollment: 2,320 students
42.6% white, 1.7% American Indian or Alaska Native, 11.9% Black or African American, 8.9% Asian, 23.3% Hispanic/Latino, 0.1% Native Hawaiian or Pacific Islander, 11.5% two or more races
Free and reduced-price lunch participation: 47.5% free, 9.7% reduced
Gifted: 15.5%
Statewide test scores (percentage who meet or exceed standards): 36 language arts, 34 math, 34 science
North Star
North Star High School, 5801 N. 33rd St.
Enrollment: 2,243 students
54.9% white, 0.4% American Indian or Alaska Native, 8.7% Black or African American, 6.5% Asian, 21.5% Hispanic/Latino, 7.9% two or more races
Free and reduced-price lunch participation: 42.1% free, 9.7% reduced
Gifted: 10.1%
Statewide test scores (percentage who meet or exceed standards): 29 language arts, 31 math, 34 science
Northeast
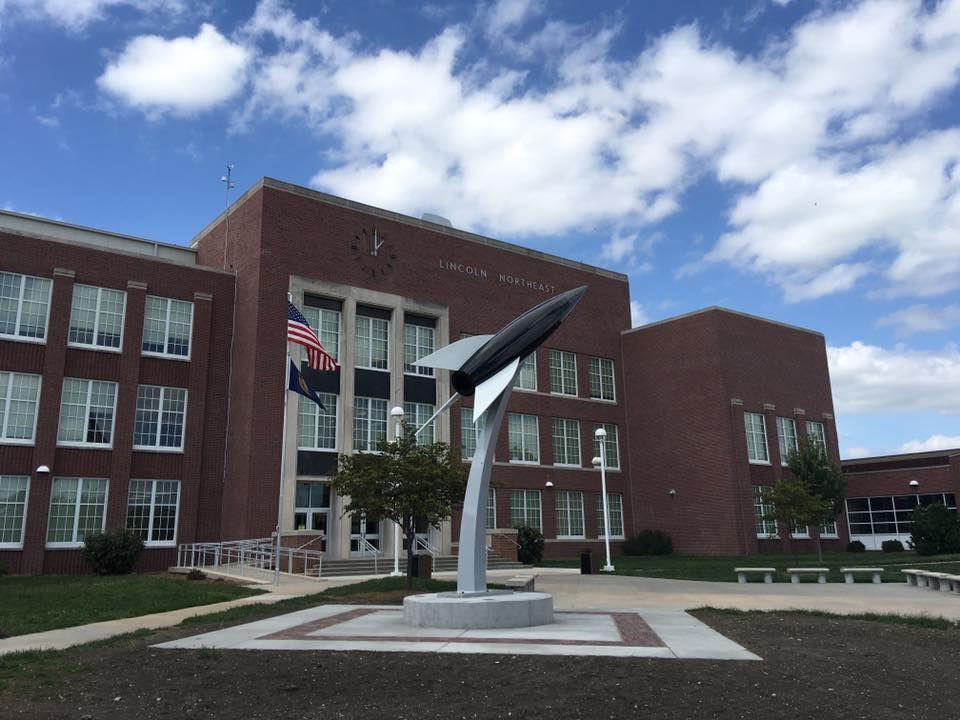
Northeast High School, 2635 N. 63rd St.
Enrollment: 1,869 students
59.4% white, 1.3% American Indian or Alaska Native, 9.7% Black or African American, 2.4% Asian, 17.1% Hispanic/Latino, 0.2% Native Hawaiian or Pacific Islander, 10.0% two or more races
Free and reduced-price lunch participation: 49.9% free, 10.8% reduced
Gifted: 10.6%
Statewide test scores (percentage who meet or exceed standards): 32 language arts, 30 math, 34 science
Southeast
Southeast High School, 2930 S. 37th St.
Enrollment: 1,980 students
73.4% white, 1.1% American Indian or Alaska Native, 3.8% Black or African American, 1.2% Asian, 10.6% Hispanic/Latino, 0.3% Native Hawaiian or Pacific Islander, 9.6% two or more races
Free and reduced-price lunch participation: 25.1% free, 7.6% reduced
Gifted: 22.6%
Statewide test scores (percentage who meet or exceed standards): 49 language arts, 48 math, 53 science
Southwest
Southwest High School, 7001 S. 14th St.
Enrollment: 2,196 students
76.8% white, 0.2% American Indian or Alaska Native, 3.9% Black or African American, 3.8% Asian, 9.6% Hispanic/Latino, 5.7% two or more races
Free and reduced-price lunch participation: 17.7% free, 5.1% reduced
Gifted: 24.4%
Statewide test scores (percentage who meet or exceed standards): 62 language arts, 58 math, 64 science
Contact the writer at [email protected] or 402-473-7225. On Twitter @HammackLJS


